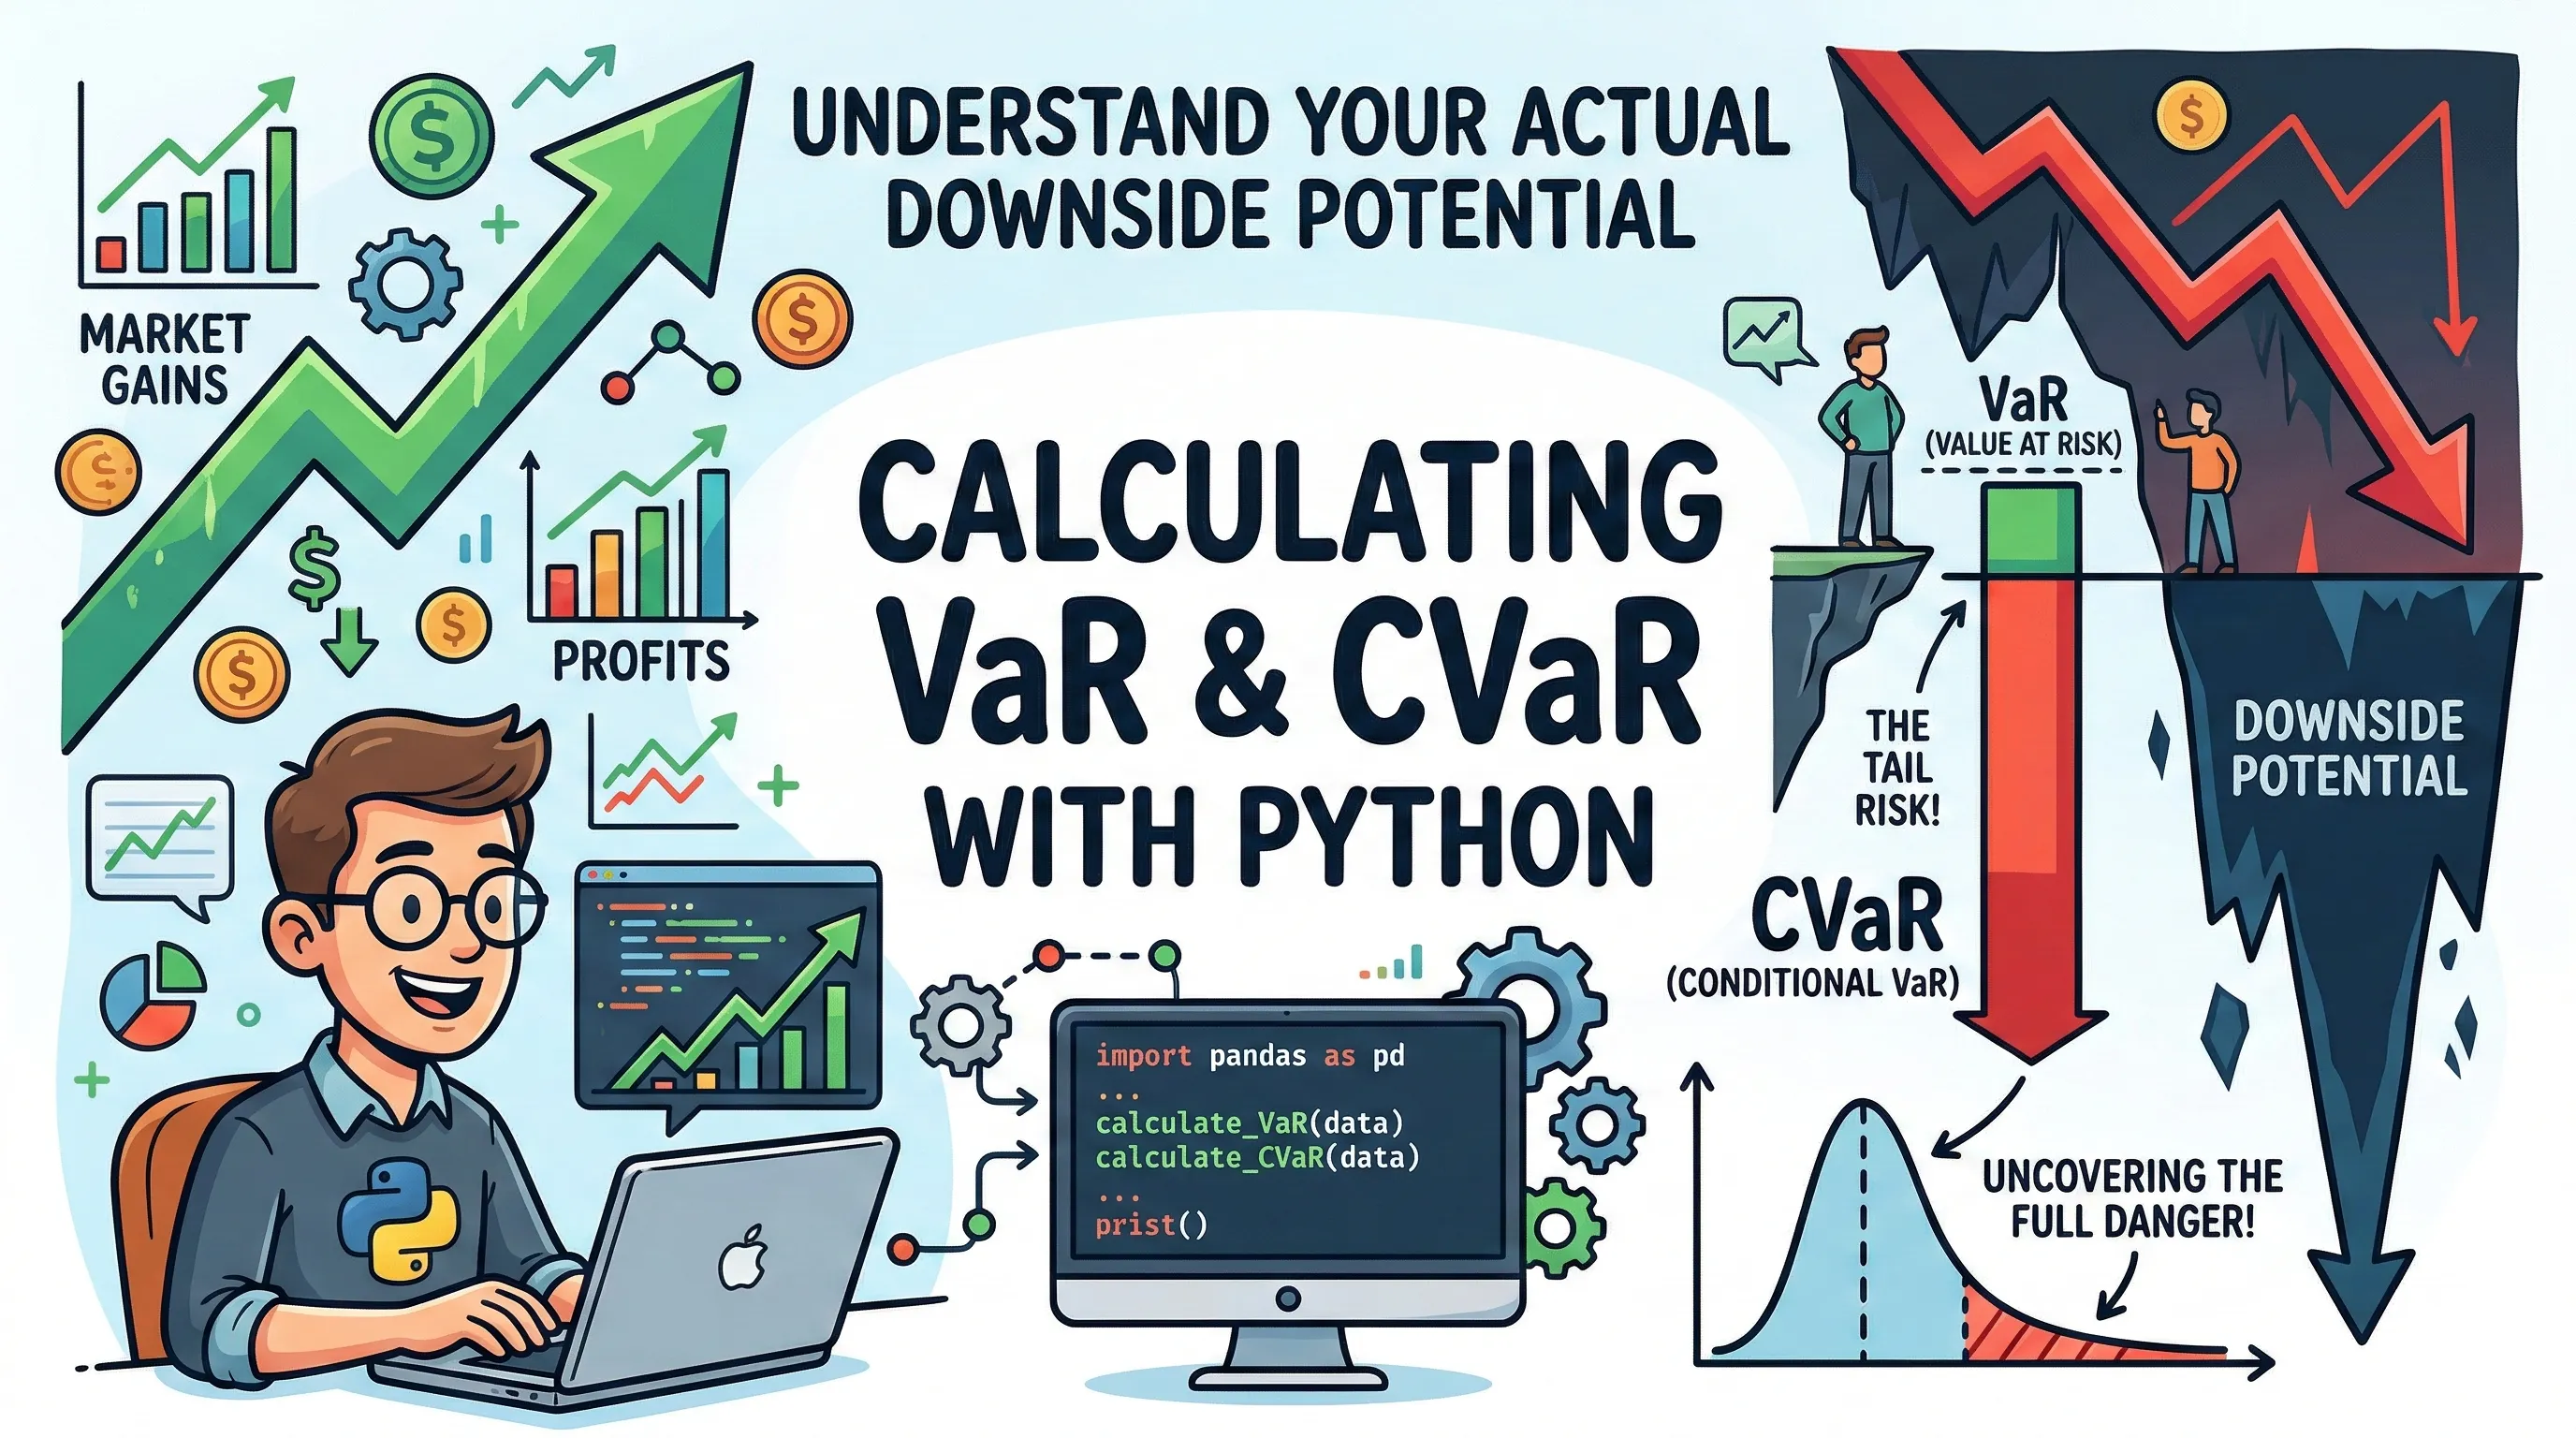
Value at Risk (VaR) vs. CVaR: A Practical Guide for Investors
Stop using abstract volatility. Learn how to calculate Value at Risk (VaR) and Conditional VaR (CVaR) using Python to understand your actual downside potential.
In finance, we often try to measure risk in terms of “volatility” or “standard deviation”. But for us, simple individual investors, a percentage like 15% volatility feels very abstract. When talking about risk, we really just want to know how much money we could lose if things go sideways. While we can look at worst case scenario’s, they are often so catastrophic (for example, every bond defaulting in a portfolio) that they paralyse the decision-making process. We need a measure that captures a worst-ish scenario while remaining statistically plausible. This is where we can use “Value At Risk” (VAR).
What is Value At Risk
VaR is a way to put a real-world number on risk. In plain language, it answers the question: “On a bad day, how much could I lose?” More specifically, VaR tells you, for example, “In only 5% of days, my loss will be worse than X.” So, instead of asking what the absolute worst-case outcome is, VaR gives us a practical boundary on how bad things can get with a certain (high) probability. Mathematically, VaR is a quantile-based measure that sets a materiality threshold. It asks: “What is the minimum amount I stand to lose of the time over a specific period ?”
- If : You are looking at the 95% VaR. Over a 1-day horizon, this tells you what your loss might look like on the 2 or 3 worst trading days of the year.
- If : You are looking at the VaR, focusing on the single worst day of the month.
There are two primary ways we can calculate VaR: looking backwards at historical data or looking forward using math.
The retrospective (historical) method
This is the most intuitive method. You take historical data (e.g., an exchange index) and calculate daily log returns, then sort them from worst to best. To find the 95% 1-day VaR, simply look at the return at the bottom 5% of your list. We can create a small Python example that uses yfinance to fetch historical data and calculate returns.
import yfinance as yf
import numpy as np

# Download TSX data (Toronto Stock Exchange)
data = yf.download("^GSPTSE", start="2000-01-03", end="2024-01-01")
data['Log_Ret'] = np.log(data['Adj Close'] / data['Adj Close'].shift(1))
returns = data['Log_Ret'].dropna()

# Calculate Historical VaR
var_95 = np.percentile(returns, 5)
var_99 = np.percentile(returns, 1)

print(f"95% 1-day Historical VaR: {var_95:.2%}")
print(f"99% 1-day Historical VaR: {var_99:.2%}")With this approach, we need to look out for the sensitivity trap. If you move just one or two spots up or down in your sorted list of historical returns, the 99% VaR changes much more than the 95% VaR. This happens because the data becomes “thinner” at the extremes. There are fewer data points in the VaR tails, which makes the average unstable.
Parametric VaR (Normal Distribution)
While history is great, we often want to model what might happen based on current volatility. If we assume stock returns follow a Normal Distribution, we can calculate VaR without sorting thousands of rows. Let’s assume we have a daily mean () of 0.02% and a daily volatility () of 1.27%:
from scipy.stats import norm

mu = 0.0002
sigma = 0.0127

# Parametric VaR calculation
var_95_param = norm.ppf(0.05, mu, sigma)
var_99_param = norm.ppf(0.01, mu, sigma)

print(f”95% Parametric VaR: {var_95_param:.2%}”)
print(f”99% Parametric VaR: {var_99_param:.2%}”)In this approach, we need to look out for the so-called “fat tails”. The earlier discussed Historical 99% VaR is often much worse than the Parametric 99% VaR. This is because real-world markets have “Fat Tails”. Extreme events happen more often in reality than the smooth bell curve of a normal distribution predicts.
Scaling VaR Over Time
Sometimes we might want to apply VaR over a longer period. We can do this by scaling the drift and volatility by time :
| Period | Horizon | 95% VaR | 99% VaR |
|---|---|---|---|
| 1 Day | 1 | -2.08% | -2.95% |
| 1 Week | 5 | -4.61% | -6.55% |
| 1 Month | 20 | -9.06% | -12.94% |
| 1 Year | 250 | -29.22% | -42.95% |
The pitfalls: Can you hack VaR
VaR is not a coherent risk measure because it can be manipulated. For example, if a trader can get a bonus from their firm for keeping the 95% VaR below €1M, they could buy insurance puts to cover small losses. However, they would need to pay for that insurance by selling deep out-of-the-money puts. This will result in the 95% VaR looking great, but in reality, they created a ticking time bomb in the 99% tail. If a true crash happens, the losses will be catastrophic.
To address this exploit in VaR, firms now use Conditional VaR (CVaR), which focuses on the average loss when the VaR threshold is breached. VaR tells you where the “danger zone” begins, and CVaR will tell you how deep the water is when you fall overboard.
In risk management theory, a coherent measure must satisfy certain mathematical properties. However, VaR fails on the property Subadditivity.
- The VaR Flaw: Combining two risky portfolios can result in a VaR that exceeds the sum of their individual VaRs. This is counterintuitive because diversification is supposed to reduce risk.
- The CVaR Fix: The CVaR of a diversified portfolio is always less than or equal to the sum of the CVaRs of its assets. It rewards diversification and cannot be hacked by simply pushing risk into extreme tails.
Calculating CVaR
To calculate the CVaR, we essentially just filter and average. Mathematical we can write this like this:
We can use the same logic we used to calculate VaR, but we need to take all returns below our VaR cutoff and compute their mean.
import numpy as np

# Assuming 'returns' is a pandas Series of historical log returns
confidence_level = 0.05  # For 95% confidence

# 1. Calculate VaR first
var_95 = np.percentile(returns, confidence_level * 100)

# 2. Identify all returns worse than the VaR
tail_losses = returns[returns <= var_95]

# 3. CVaR is the average of those tail losses
cvar_95 = tail_losses.mean()

print(f"95% 1-day VaR: {var_95:.2%}")
print(f"95% 1-day CVaR: {cvar_95:.2%}")In the result, we can see that the 95% VaR is -2% and the 95% CVaR is -3.5%. This means that there is a 5% chance your loss will be at least 2%, and if you end up in the worst 5%, your average loss will be 3.5%.
The illustration below also shows why CVaR is a more robust risk measure than standard VaR, particularly when the market returns don’t follow a perfect bell curve. In this chart, we compare a standard Normal Distribution to a fat-tailed distribution, which better represents a real-world example. Notice that the VaR is just a single point on the x-axis, indicating the boundary of the 5% worst cases. At the same CVaR captures the average of all the data to the left of that VaR border. In a fat-tailed market, the average of the worst cases is significantly to the left of the VaR threshold.
Recall the trader who sold deep out-of-the-money puts to lower their VaR. Under VaR, their risk looks lower because the 95th percentile hasn’t moved. But under CVaR, their risk would skyrocket, since all losses in the tail are now averaged. Those massive potential losses from the sold puts would be captured in the average, exposing the strategy as high risk.
⚠️ Financial Education Disclaimer
The quantitative models and Python code provided in this post (including the Value at Risk and CVaR calculations) are for educational and research purposes only.
- Not Financial Advice: This content does not constitute professional financial or investment advice.